Spearmans rank correlation coefficient
Information
Sometimes when we are given data we are not given the precise values but instead only the rank of the value when compared to the rest of the data set, this means that we cannot use pmcc in order to find the correlation between values but instead we use Spearmans Rank Correlation coeffient to get a better understanding of the datas relationship with eachother
For example if a judge ranked contestants in order from 1 to 10
We can find the Spearmans Rank correlation Coefficient using the equation below:
$$r_{s} = 1 - \frac{6\sum{d^2}}{n(n^2-1)}$$
(Where d is the difference between pairs of ranks)
As with pmcc, srcc is rated from -1 to 1
Example 1
| Tomato | A | B | C | D | E | F | G | H |
| Rank Judge 1 | 1 | 8 | 4 | 6 | 2 | 5 | 7 | 3 |
| Rank Judge 2 | 7 | 2 | 3 | 4 | 6 | 8 | 1 | 5 |
| (Judge 1 - Judge 2) d | -6 | 6 | 1 | 2 | -4 | -3 | 6 | -2 |
| d² | 36 | 36 | 1 | 4 | 16 | 9 | 36 | 4 |
$$n = 8$$
$$\sum{d^2} = 142$$
$$r_{s} = 1 - \frac{6\sum{d^2}}{n(n^2-1)} = 1 - \frac{6×142}{8(8^2-1)} = -0.690$$
This means thats there is a strong negative correlation between the judges
Therefore the judges disagree on which tomatoes are the best
Example 2
Using the information given below create a table that shows the rankings that each judge has given with the difference and the difference squared
(Rankings in order of best to worst)
Judge 1:B,F,A,C,D,I,J,G,E,H
Judge 2:F,C,D,B,A,G,E,I,J,H
| Entrant | A | B | C | D | E | F | G | H | I | J |
| Rank Judge 1 | 3 | 1 | 4 | 5 | 9 | 2 | 8 | 10 | 6 | 7 |
| Rank Judge 2 | 5 | 4 | 2 | 3 | 7 | 1 | 6 | 10 | 8 | 9 |
| (Judge 1 - Judge 2) d | -2 | -3 | 2 | 2 | 2 | 1 | 2 | 0 | -2 | -2 |
| d² | 4 | 9 | 4 | 4 | 4 | 1 | 4 | 0 | 4 | 4 |
$$n = 10$$
$$\sum{d^2} = 38$$
$$r_{s} = 1 - \frac{6\sum{d^2}}{n(n^2-1)} = 1 - \frac{6×38}{10(10^2-1)} = 0.770$$
This means thats there is a strong positive correlation between the judges
Therefore the judges agree on which entrant is the best
Joint Ranks (Not in WJEC Syllabus)
This is not in the WJEC Syllabus so if you want you can skip this information however it is useful to know if you wish to carry on with statistics to a higher level
In order to take into account tied rankings all you need to do is give both pieces of data the mean rank if they were not tied
(e.g. with 2 joint 3rd = [3+4]/2 = 3.5, or with 3 joint 2nd = [2+3+4]/3 = 3)
| x | 4 | 7 | 9 | 4 | 8 | 6 |
| y | 10 | 8 | 6 | 12 | 8 | 10 |
| Rank for x | 1.5 | 4 | 6 | 1.5 | 5 | 3 |
| Rank for y | 4.5 | 2.5 | 1 | 6 | 2.5 | 4.5 |
| d | -3 | 1.5 | 5 | -4.5 | 2.5 | -1.5 |
| d² | 9 | 2.25 | 25 | 20.25 | 6.25 | 2.25 |
$$n = 6$$
$$\sum{d^2} = 65$$
$$r_{s} = 1 - \frac{6\sum{d^2}}{n(n^2-1)} = 1 - \frac{6×65}{6(6^2-1)} = -0.857$$
This means thats there is a very strong negative correlation between the judges
Example 3
Part a
Given the rankings from the judges below construct a table showing the rankings with the difference and difference squared
Then calculate the spearmans rank correlation coefficient
| Entrant | A | B | C | D | E | F | G | H | I | J |
| Rank Judge 1 | 5 | 2 | 6 | 8 | 1 | 7 | 4 | 9 | 3 | 10 |
| Rank Judge 2 | 1 | 7 | 6 | 10 | 4 | 5 | 3 | 8 | 2 | 9 |
| d | 4 | -5 | 0 | -2 | -3 | 2 | 1 | 1 | 1 | 1 |
| d² | 16 | 25 | 0 | 4 | 9 | 4 | 1 | 1 | 1 | 1 |
$$n = 10$$
$$\sum{d^2} = 62$$
$$r_{s} = 1 - \frac{6\sum{d^2}}{n(n^2-1)} = 1 - \frac{6×62}{10(10^2-1)} = 0.624$$
This means thats there is a strong positive correlation between the judges
Therefore the judges agree on which entrant is the best
Part b
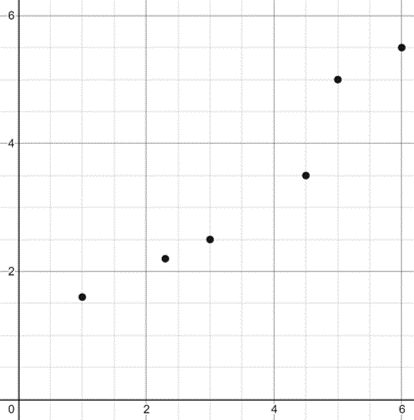
Does a srcc of 1 imply that the data will point in a straight line on a scatter graph?
No, all a srcc of 1 means is that the ranks are all in the same order for instance the graph shown below:
Part c
When is it appropriate to use Spearmans rank correlation coefficient?
It is appropriate to use Spearmans rank correlation coefficient when data is given in the form of ranks, or when data is not taken from a bivariate normal population
(When not appropriate to use 'pmcc')
Part d
Spearmans rank correlation coefficient is an example of a non-parametric test, What does 'non-parametric' mean?
In a non-parametric test no assumptions are made that implies the samples are from any particular statistical distribution
Causation and Spurious Correlation
Causation means when increasing one thing (e.g.Height) will cause an increase or decrease in another thing (e.g.Weight)
For instance when climbing a mountain (Increase in height) the temperature decreases so there is a negative correlation due to causation
Spurious Correlation means that two things correlate however they actually have no effect on eachother
For example increasing the number of food shops in a town leads to an increase in bank robberies
However these most likely actually both correlate with an increase in population and do not correlate with eachother and is therefore spurious correlation as they do not effect eachother